
Sitting at home on a snowy, Sunday afternoon with not a whole lot to do that I was interested in doing, I found myself geeking out on the Watershed Advisors’ NAEP analysis tool. I did have one eye on the UCONN women’s basketball game on TV and checked Twitter (X) periodically for updates on how my Harvard women’s team was was faring against Columbia. Statement road wins for both UCONN and Harvard, but I digress.
I was lost in the NAEP analysis tool for hours. Seriously, with its three Proficiency Level tabs and three Scaled Score tabs, plus options for results by subgroups and percentiles, that thing is the state assessment specialist’s version of falling into a video rabbit hole on your favorite social media platform.
I started out where I always do when reviewing assessment data, looking at the stability of scores across years. One of the first things that I learned as a data analyst working with state assessment data is that change is bad, but variability is good. That is, notwithstanding all of the resources being funneled into education reform, you really don’t expect to see or want to see anything resembling dramatic change from one test administration to the next at the top level; that is, national public for NAEP, state for state assessments. Generally, a large change at that level is a clear signal that you did something wrong. Conversely, you do want to see variability in aggregate scores below the top level. Unless you’re facing something like a country emerging from a pandemic, the last thing that you want to see is all of the scores going in the same direction – up or down. Again, usually a red flag that you did something wrong.
After variability, I tend to look at variance. Generally, you expect to see variance in student scores decrease over time. That is, if the student standard deviation is set at 300 when establishing the scale in the first year of an assessment program, you might expect to see it shrink a bit across subsequent administrations. Now, NAEP and its scale, as we all know is a different animal; and we tend not to think in terms of the standard deviation of NAEP student scores. We do, however, have the reported percentile breakdowns. I was a bit concerned in 2017 when, coinciding with the shift to computer-based testing, I started to see the distribution widening rather than shrinking, with high scores getting higher, low scores getting lower, and middling scores staying flat. With each successive test administration since 2017, however, it seems clear that we are witnessing the bottom fall out of the distribution and not some statistical anomaly or psychometric artifact. Good news for data analysts and psychometricians, bad news for everyone else.
Sticking with the percentiles, I started looking at the range of state scores at each percentile rank, a statistic displayed nicely by the analysis tool. Not much seemed to jump out there. In general, the range of state scores was consistent across percentile ranks within each content area (e.g., approximately25-30 points) and the scaled score gap between percentile ranks (10 to 25, 25 to 50, 50 to 75, 75 to 90) was also pretty consistent (again 25-30 points).
The lone exception was Grade 4 Mathematics where the range of states’ scores at the 10th percentile was 50, with a high of 202 in Mississippi and Wyoming to a low of 172 in Alaska – with Oregon, DC, and New Mexico scoring not that much higher than Alaska. Another piece of evidence that from east to west and north to south the bottom is falling out beneath our feet.
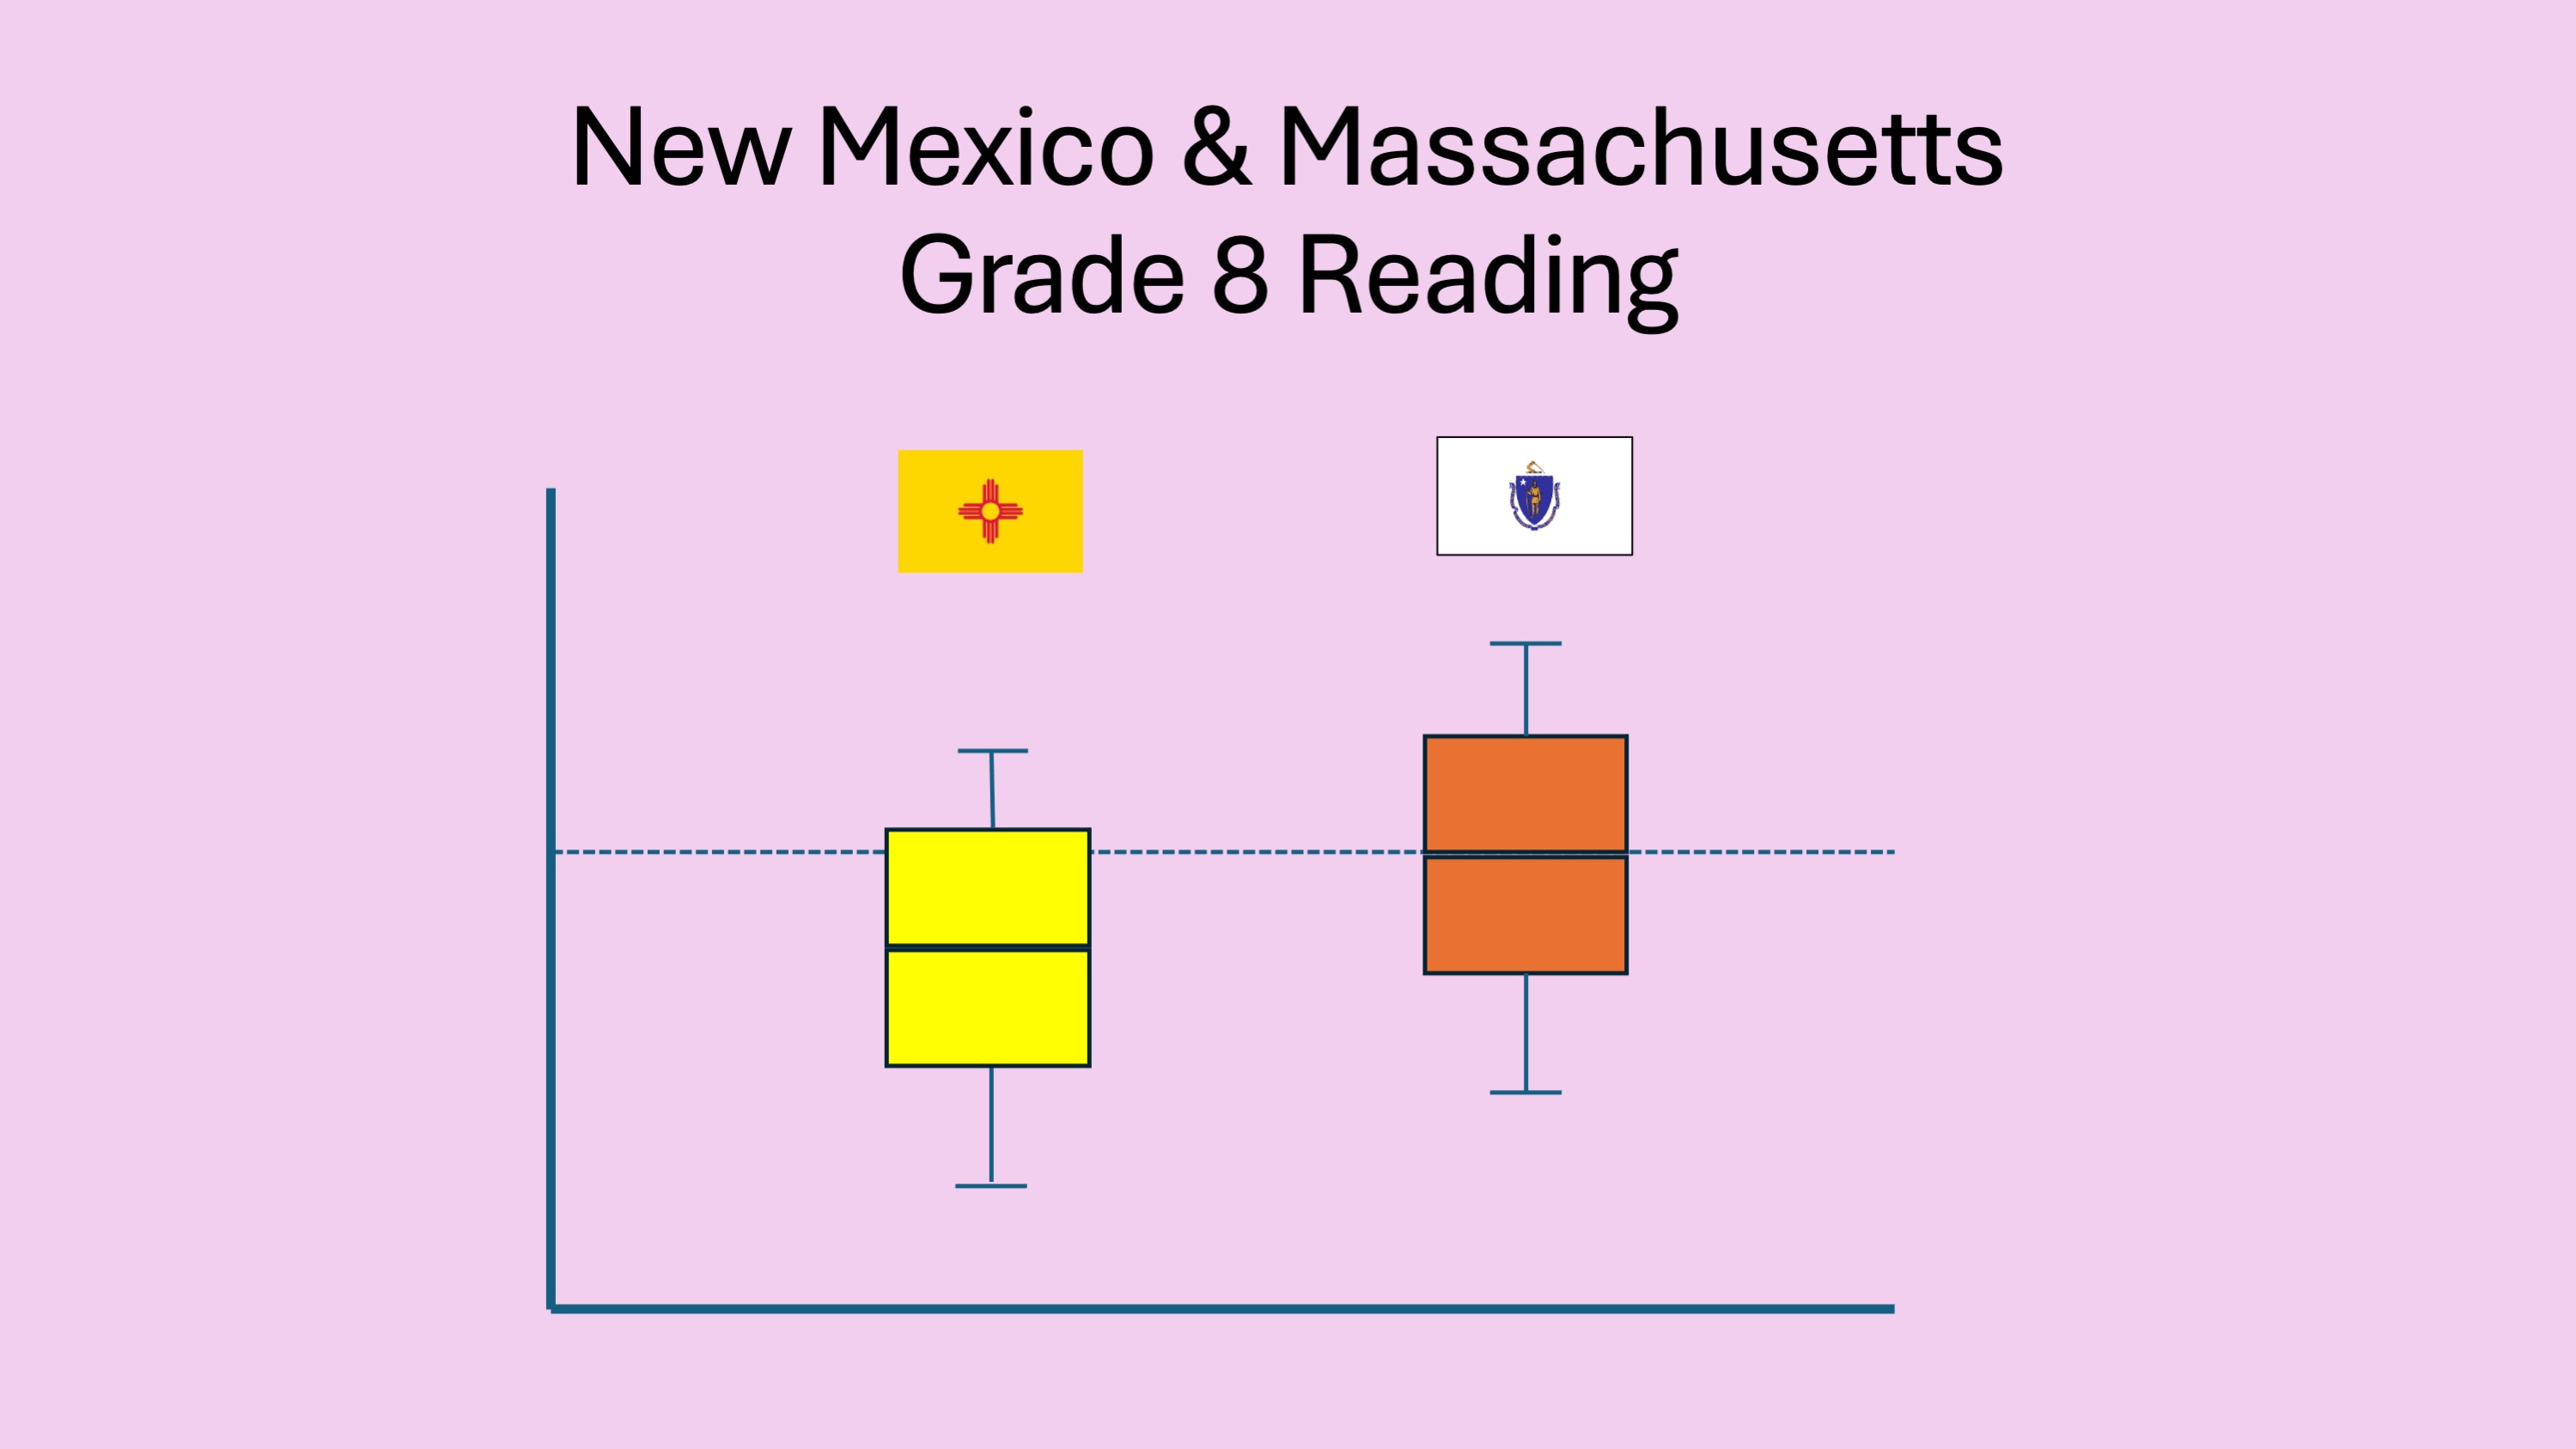
Next, I moved on to variation in scores between the highest and lowest performing states, Massachusetts and New Mexico, respectively. (For those keeping track at home, we’ve moved from variability to variance to variation.)
As expected, I found a healthy degree of overlap even between scores in the highest and lowest scoring states. Across the four NAEP tests, the average and median scaled scores in New Mexico tended to be equal to the 25thpercentile score in Massachusetts. Digging a little deeper
- The 90th percentile scores in New Mexico tended to be close to the 75th percentile scores in Massachusetts.
- The 10th percentile scores in Massachusetts tended to be close to the 25th percentile scores in New Mexico.
In short, as depicted below, clearly a big gap in performance between the two states, but not total separation between states at the two extremes of national performance. A good sign.
It’s Still Socioeconomic Status
My final stop were the scores disaggregated by race/ethnicity and socioeconomic status. It was in comparing the range of state scores of “Economically Disadvantaged” and “Not Economically Disadvantaged” students that the 2024 NAEP results hit me in the face with a sledgehammer. For all intents and purposes, there was no overlap between the scores of the two groups. In other words, across all states
The highest scoring “Economically Disadvantaged” subgroup scored lower than the lowest scoring “Not Economically Disadvantaged” subgroup.
As shown in the figure below for Grade 4 Mathematics, the lone exception was New Mexico, where “Not Economically Disadvantaged” fourth grade students performed scored 235, just at high end of the “Economically Disadvantaged” students in all other states which ranged from 234 to 260. At the eighth grade, there was no overlap at all between the two groups.
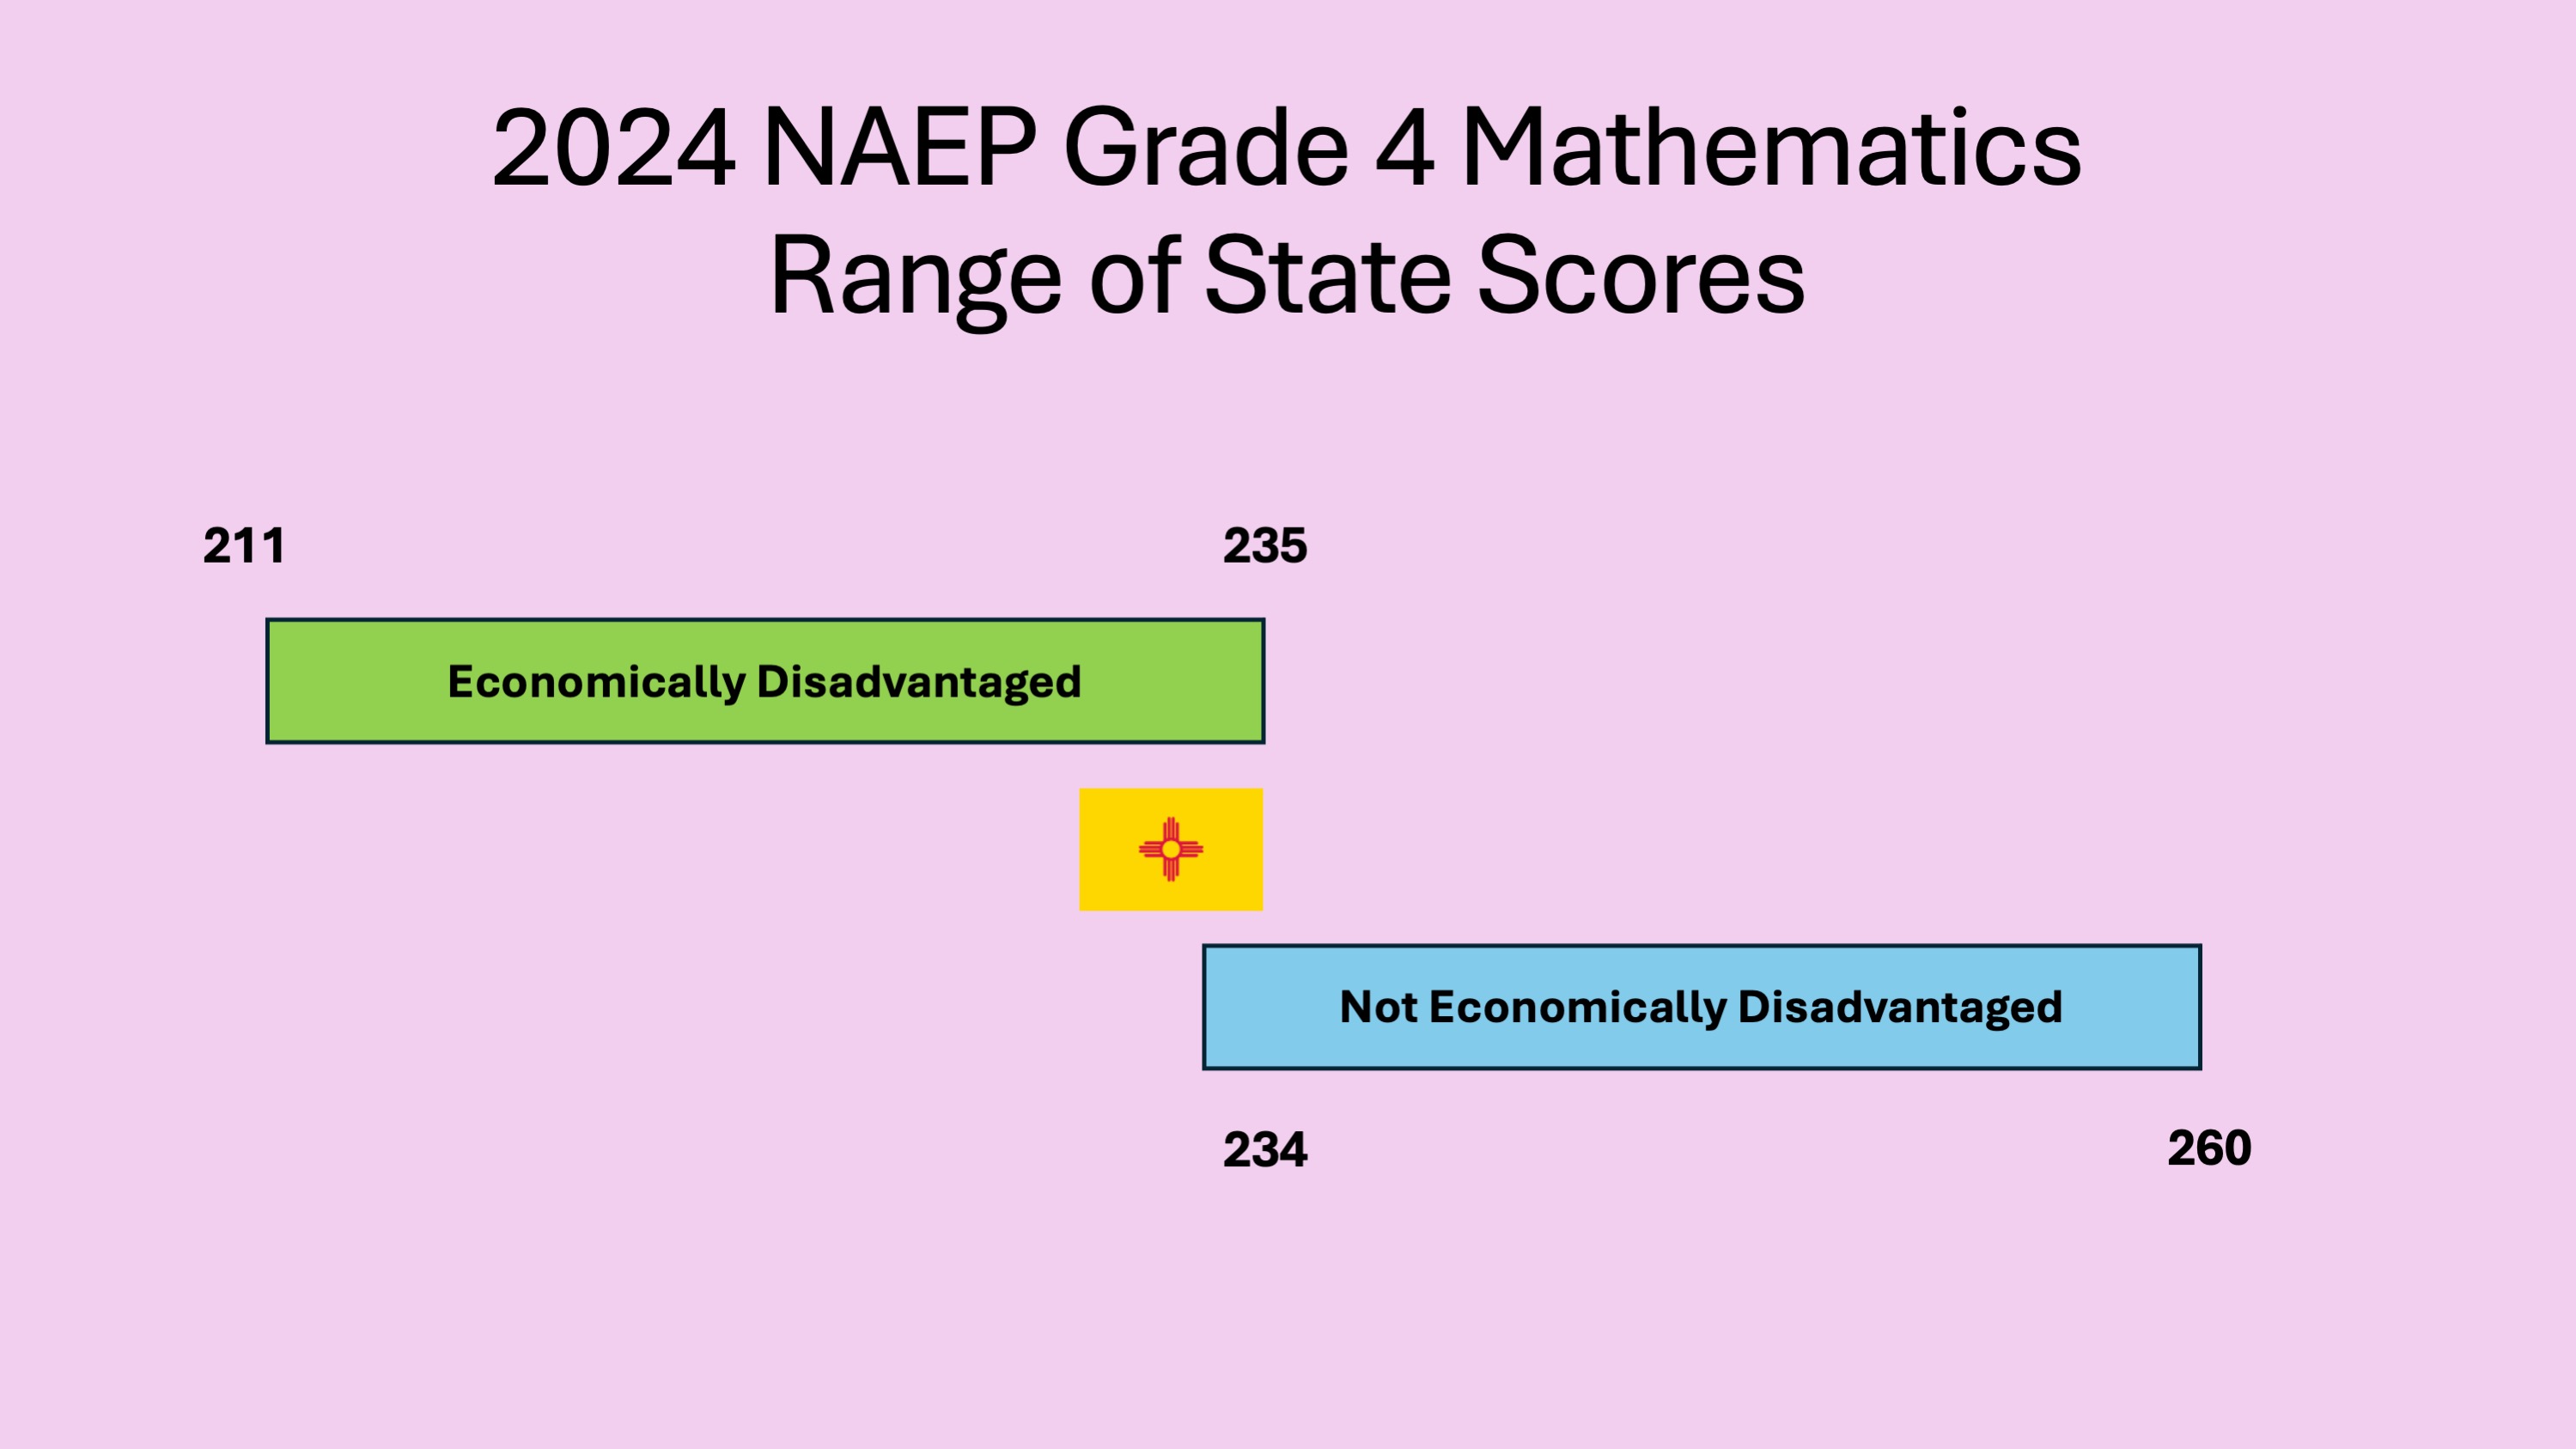
Aside from providing additional evidence that something must be attended to in New Mexico, these results confirm what the Coleman Report told us in 1996: student achievement is affected by factors outside of school, namely families and socioeconomic status. Therefore, that the 2024 NAEP results showed a clear achievement gap based on economic status was more of a foregone conclusion than a surprise.
The fact, however, that unlike my Massachusetts and New Mexico comparison there was no overlap was stunning and stark. Yes, I know that I am somewhat comparing apples and oranges here in that the two comparisons are not identical, nevertheless, my gut expectation was that even economically disadvantaged kids in our highest performing states would be performing at least as well as the non-economically disadvantaged kids in our lowest performing states. But that expectation was wrong.
To paraphrase James Carville, it’s SES, stupid.
The issue now, therefore, as it has been since 1966, is what we, as assessment specialists, educators, educational researchers, and educational policymakers do with this information.
Two roads diverged…I could not travel both
With regard to the Coleman Report, SES, family influence, and student achievement we tend to view the role of schools from an all-or-nothing, black-or-white perspective (no pun intended).
When I started taking education courses in college in the early 1980s, the syllabi were littered with books and articles claiming, demonstrating, or claiming to demonstrate that school reforms could not offset or overcome the effects of external factors such as SES.
By the time I was in graduate school a few years later, the field was firmly ensconced in the effective schools and effective instruction movements. I still recall the slide that my professor Jim Ysseldyke shared listing seven major instructional factors identified by research to promote effective instruction:
- Instructional match
- Feedback
- Monitoring of student performance and understanding
- Cooperative learning
- Relevant practice (guided then independent)
- Personalized instruction
- Adaptive Instruction
Along with the slide listing “Three Especially Critical Factors”
- Differentiated Instruction (Match)
- Academic engaged time
- Progress Monitoring (IF used to adapt instruction)
In the intervening decades, careers have been built around these factors; and with perhaps some minor tweaks to the labelling, those same factors are considered critical today to improving instruction and student learning. And instruction and learning have improved.
But the pragmatist in me knows that schools alone cannot offset differences in external factors like socioeconomic status. None of us chose this field, however, because we were pragmatists. The idealist and dreamer in me wants desperately to believe the words that Kristen Huff wrote in a recent post on LinkedIn:
So what do we do? I’d argue now as I’ve argued before (here) that we need to double down on our core belief that with the right supports, over time, all students can reach grade level—and put policies and practices in place to support educators and students to achieve this ambitious but attainable goal. We must deeply understand what systems of resources and supports teachers require to help students who are most in need of effective instruction to exceed expectations. There are plenty of examples (here andhere).
Teachers across the nation, when provided with the right resources and the right support, are doing exactly what this country needs for our students. When teachers have timely, actionable data from meaningful assessments. When they have research-based curricular materials and instructional strategies at the ready. And, when they have a professional support network to address complex implementation issues, they can and do work miracles for our students. We see this truth in classrooms we serve every single day.
I still cringe when I recall the urban superintendent who insisted that she be given bonus points in the accountability system for getting those kids to Proficient. And, in general, I have little use for demographically adjusted scores and the message that they send, albeit inadvertently.
At the same time, I know that a functioning education system cannot be based on teachers and principals who work miracles. And I “know” that all of the thoughtful solutions for improving NAEP scores and student achievement that have been proposed over the past few weeks will achieve limited success because they are only school-based solutions. They may move the needle a little, on the margins. Like the original “Texas Miracle” that spawned NCLB, those solutions may move students from Below Basic to Basic.
Moving students from Basic to Proficient and above and wherever else we need to go in the 21st century will require changes to society far beyond changes to schools. We know that societal changes cannot occur overnight and even when implemented may not show up in test scores for years and years. But we have to start somewhere, sometime.
If not us, who. If not now, when.
We are fast approaching the 60th anniversary of the Coleman Report, and the nation’s 250th anniversary. Looking back 50 years to the Bicentennial, we can easily identify positive changes to society and education that are the result of seeds of ideas and beliefs planted in the 1970s. While still working to improve the present, it’s time now for us to look beyond the next set of assessment results and accountability reports to sow the seeds for the society and education system we want people to see in 2076.
As tempting as it is to focus on self-preservation as we are spurred to action in these turbulent times and as valuable as our current research projects may be, let’s direct a little bit of that activist spirit toward the long game and the legacy we leave to our grandchildren.

One thought on “It’s Socioeconomic Status, Stupid”
Comments are closed.