
On the four-hour drive home from Albany the other day, I listened to music and reflected on the first half of 2025. Professionally, it’s been an eventful six months with a lot of positives. My book, Fundamentals and Flaws of Standards-Based Testing, was published. A mention in Andrew Ho’s NCME presidential address. The fifth edition of Educational Measurement and our chapter, Assessment to Inform Teaching and Learning, delayed yet again, is oh so tantalizingly close to publication. My blog is on pace for a banner year. I’m preparing to teach again in the fall for the first time since 2012.
And with my weight trending in the right direction, albeit not at the pace envisioned in January, I am ready to take on the second half of the year with a renewed passport and a renewed spirit.
Yet, there is one lingering issue from the first half of the year that I cannot seem to wrap my head around, and it’s related to the 2024 NAEP results. No, it’s not the continued decline in performance since 2013 that has captured my attention. Nor is it the bottom falling out across the last few test administrations. The result that I just can’t seem to wrap my head around is the overlap, or lack thereof, between the performance of Black and White subgroups of students across states.
A Study in Black and White
We are all familiar with the persistent gap in performance between Black and White students, so the overall differences between the groups, although alarming, was not a surprise.
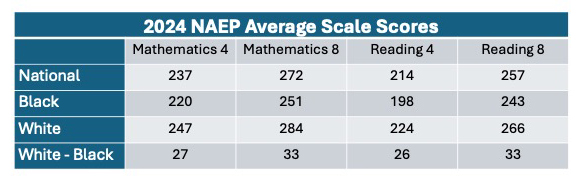
I was not even surprised that there is a Black-White gap in each of the 39 states plus the District of Columbia in which results were reported for both Black and White students. Those gaps ranging from a whopping 58 scale score points in DC to a low of 15 points in West Virginia, with an average gap of 29 points.
Living in what is routinely referred to as one of the “whitest” states in the country, I was somewhat surprised that while Maine had results for both subgroups (and a somewhat “average” 29-point gap), there were 11 other states in which results for Black students were not reported. That lack of reported results means that in 11states it is more difficult to even have the necessary conversations about the gap in performance between Black and White students. One may argue that although they represent 22% of all states, those 11 are small, accounting for only 47 electoral votes, approximately 9% of the total (what do you know, I found a useful application for electoral votes). True, but the problem exists and the tough conversations must take place in each and every state.
What really surprises me, however, is the lack of overlap between Black and White performance across states. If you had asked me in advance of the results, I would have expected that Black students in several of our highest performing states would, on average, be outperforming White students in low performing states; but that simply is not the case.
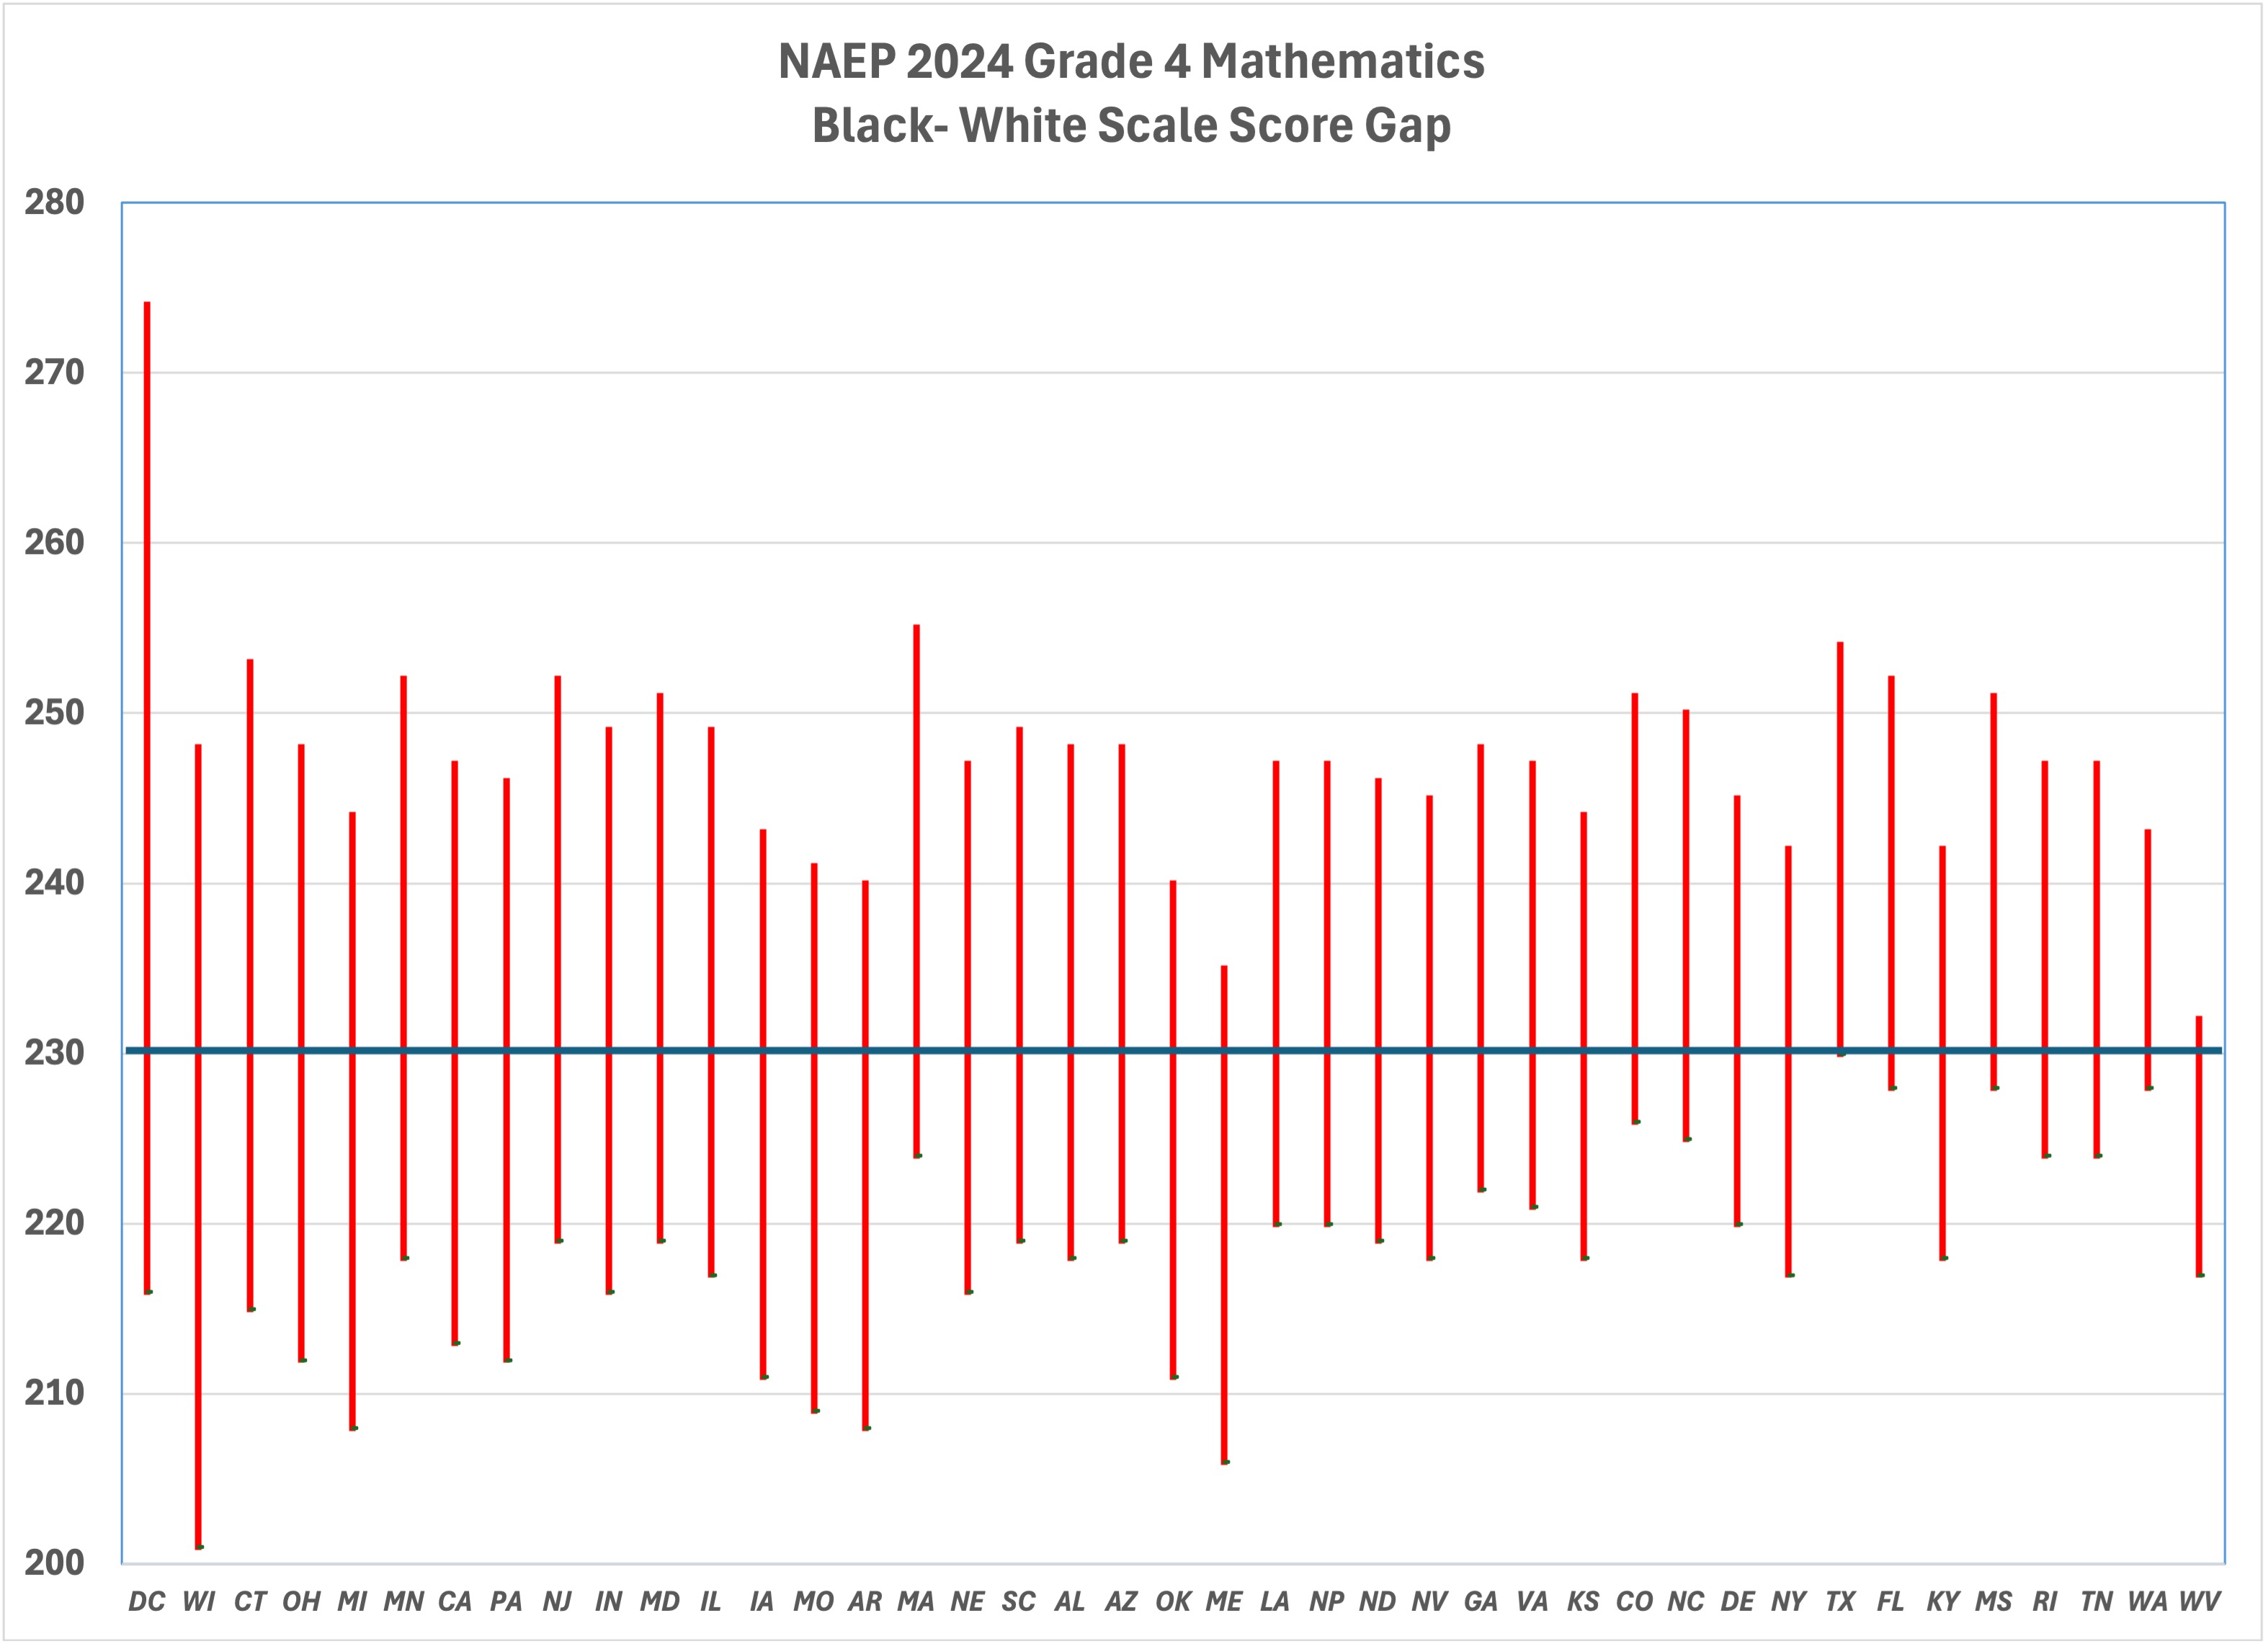
Close inspection of the plot of gaps in Grade 4 Mathematics (aided by the solid blank line) reveals the highest performing Black subgroup (in Texas) has an average scale score of 230 and the lowest performing White subgroup (in West Virginia) has an average scale score of 232.

The table above reveals similar results on each of the four 2024 NAEP tests. On the Reading tests at grades 4 and 8, there is just the smallest bit of overlap. The seemingly large overlap at grade 8 is actually due to two outliers – high performing Black students in Colorado and low performing White students in West Virginia.
How should I interpret these results?
What am I to make of the fact that in across the entire country, even the lowest performing groups of White students outperform the highest performing groups of Black students on the NAEP tests?
As for the possibility that this phenomenon is an artifact of the pandemic, a quick peek at Grade 4 Mathematics results from the 2013 NAEP administration – the peak of state NAEP performance – dispelled that thought.
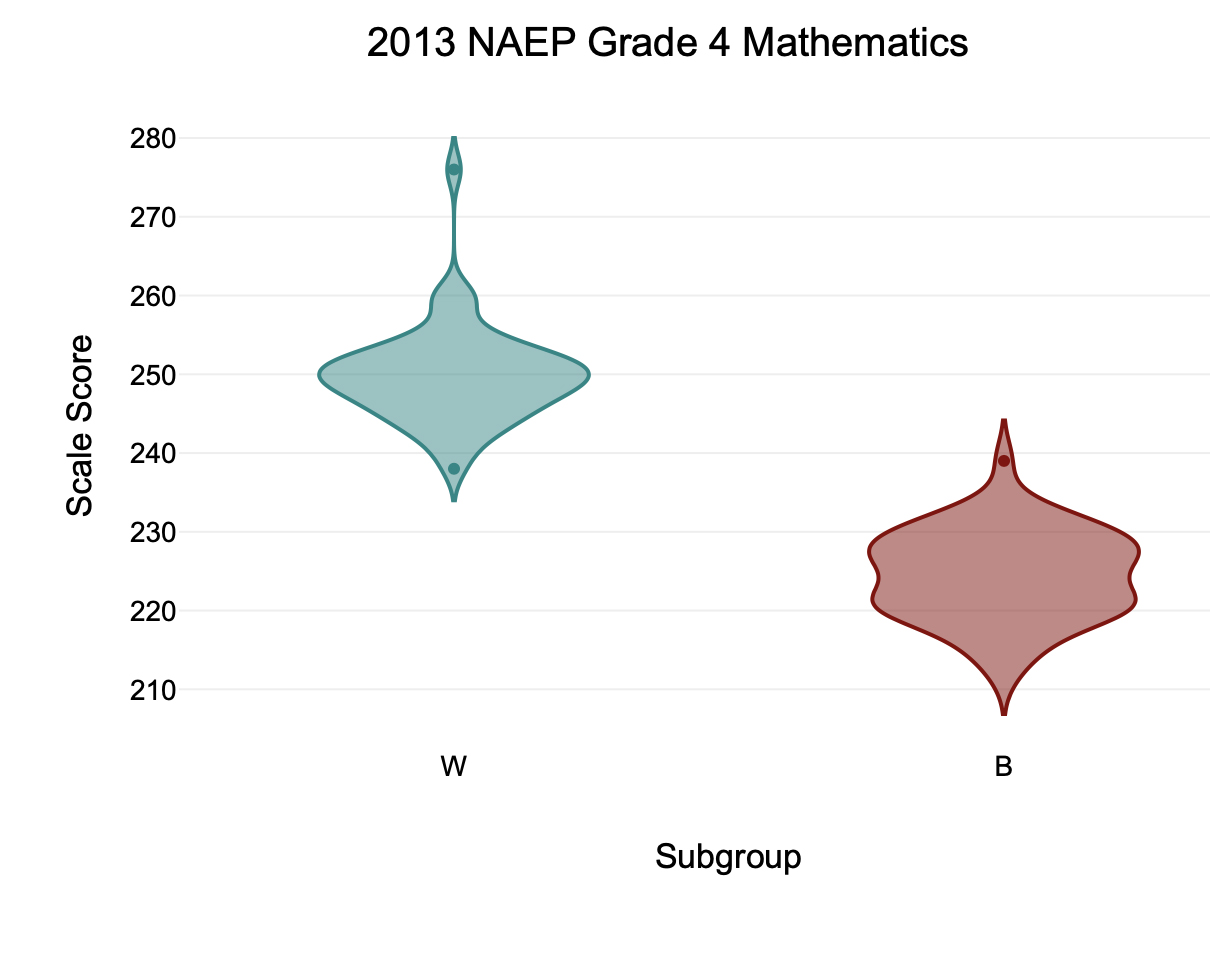
Results in 2013 were eerily similar to 2024, with only the consistent performance of White students in West Virginia and a blip from the small sample of Black students in North Dakota connecting the two groups (note: by 2024 Black students from ND were in the middle of the pack). The density plot shows a 25-point gap is typical between the groups – which if you believe in such things reflects a 2-3 year gap in performance between Black and White students.
The 2013 plot also shows that a ceiling for the Black subgroup of approximately 225-230, the same place that it is in 2024. That’s enough to make one ask what type of knowledge and skills must one demonstrate on NAEP to break through a scale score of 230.
What then is the explanation?
Of course, the pskeptical, pcynical psychometrician in me immediately remembers a story told long ago about how a Black student and White student with the exact same responses on NAEP would receive difference scores because of their group means. Could this phenomenon be related to the way subgroup results are computed on NAEP. Is there something Bayesian afoot? (And no, I don’t really know what that question means, but it sounds cool.) More likely than not, the answer is no.
The more probable answer is the long-known impact on achievement of socioeconomic status and the relationship between SES and race is a major factor. In a previous post shortly after results were released, I showed a similar lack of overlap for Economically Disadvantaged and Not Economically Disadvantaged subgroups, which was eye-opening in its own right. But as suggested in the title of this post (courtesy of Paul Simon), everything looks worse in Black and White.
The Truth Is Self-Evident
SES alone is not a sufficient explantation for differences in performance related to race.
In addition to reaching the midpoint of 2025, we also celebrate two important anniversaries this week.
July 4th is the 249th anniversary of the Declaration of Independence with its proclamation
We hold these truths to be self-evident, that all men are created equal, that they are endowed by their Creator with certain unalienable Rights, that among these are Life, Liberty and the pursuit of Happiness.
July 2nd is 61st anniversary of the signing of the landmark Civil Rights Bill of 1964. On that occasion, President Johnson noted
We believe that all men are created equal. Yet many are denied equal treatment.
We believe that all men have certain unalienable rights. Yet many Americans do not enjoy those rights.
We believe that all men are entitled to the blessings of liberty. Yet millions are being deprived of those blessings – not because of their own failures but because of the color of their skins.
But it cannot continue. Our Constitution, the foundation of our Republic, forbids it…. Morality forbids it. And the law I will sign tonight forbids it.
We, as a nation, as a field, and as people, have made progress since 1964 but there is no denying that inequities remain in access to adequate (let alone high-quality) educational resources which limits opportunity to learn. There is also no denying that many of those inequities are at a minimum related to, if not directly based on, race.
The Elephant In The Room
We made a promise in 1994 to Improve America’s Schools and a commitment in 2001 that there would be No Child Left Behind.
In the last decade or so, it seems that we have lost our focus on keeping that promise and honoring that commitment. That loss of focus is evident in the decline in NAEP scores and even in the naming of the 2015 reauthorization. In a subtle way perhaps, Every Student Succeeds shifts the onus for educational success from the school, districts, community, state, and nation to the student – a perverse manifestation of student agency.
Whatever path we’ve been following since 2013, we are clearly steering in the wrong direction. We need a course correction.
It’s time to refocus, renew, and recommit.
The evidence is clear.
It’s right there in Black and White.
Header Image by Thomas Zbinden from Pixabay

One thought on “Everything Looks Worse in Black and White”
Comments are closed.