
I wrap up my March series, NAEP by the Numbers, with the number .05 and a discussion of significance and differences. The significance of NAEP lies far beyond score differences within and across years that are statistically significant at the .05 level. Much of what makes NAEP significant is that it is different. Different from state tests. Different from tests administered by schools and districts. It serves a different purpose. A purpose for which it is well-designed. Simply put, NAEP is NAEP.
Category Archives: NAEP
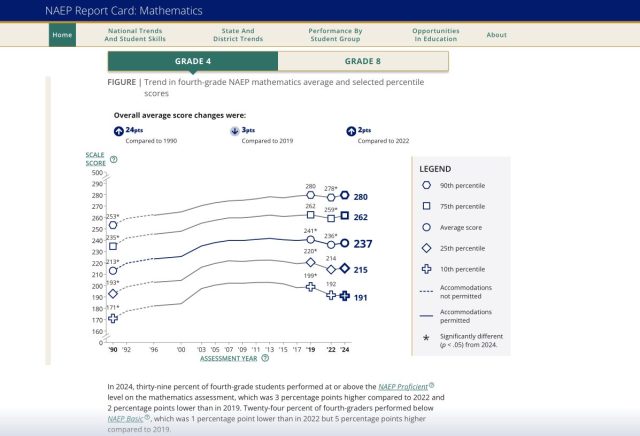
#NAEP250 – It’s Trending

“All good things must come to an end.” In the third post of my NAEP by the Numbers series, I ponder historically, philosophically, and a little bit technically, on whether that time has come for something that many believe are very good things – the NAEP trend lines.
Batting .500 with the NAEP Scale

In the second post of my NAEP by the Numbers series, I reflect on the NAEP 0-500 scales: both the Long Term Trend scale that stretches back to the 1970s and the new scale developed when NAEP began reporting state results some 35 years ago. At times, impressive. Other times frustrating. Love it or hate it, there’s nothing in our field quite like the NAEP scale.
20 at the 10th
For March, I’m planning a series of posts looking at NAEP by the numbers. The first two numbers are 20 and 10, as in the 20 students performing at the 10th percentile in reading and mathematics in a typical NAEP state sample. We’re all concerned that the bottom has been falling out of NAEP results, but my question is just how well we understand who those 10th percentile students are.
The 10th percentile sitting out there 1.28 sd from the mean is kind of an abstract concept, but a classroom-size sample of 20 kids is something we should be able to wrap our heads around.
The Life Of A Show-and-Tell Girl

As Executive Director of the National Assessment Governing Board (NAGB), Lesley Muldoon has many responsibilities that most of us will never see nor understand. But the public-facing aspect of her job is to serve as front person and ringmaster for the release of NAEP results. This week, she was put in an unenviable position because of that enigma known as 12th grade NAEP. Let’s not make her go through that again.
Everything Looks Worse in Black and White

There’s a lot to reflect on as we reach the midpoint of 2025, but one story that’s stuck in my craw is the performance of Black and White students on the 2024 NAEP tests. Not the achievement gap per se, we are all too well aware of that, but rather the lack of overlap between the two groups. I’m not sure what to make of that.
It’s Socioeconomic Status, Stupid

I thought that I was done writing about the 2024 NAEP results. I had nothing to add to all of the thoughtful recommendations for improving student achievement. But then after spending an afternoon playing with the Watershed Advisors NAEP analysis tool, it hit me that there was still one more thing to say. The problem, as we all know, is bigger than us and the solution must be as well.
misReading Our Mathematics Problem

All too often we consider test results separately by content area. We’ve started to think of English language arts and literacy skills as interdisciplinary, but until I started thinking about the 2024 NAEP results, I don’t think that I fully grasped the connection between student performance in reading and mathematics.
Are We Dumber Or Just Different?

In a preemptive shot ahead of the 2024 NAEP results we were told that Americans have been getting dumber. Perhaps, but I’m not sure that’s a conclusion we can reach based on an average scaled score – even on NAEP. And I’m fairly certain it’s not the best question to be asking tomorrow when those scores are released.
NAEP, Why Must You Vex Me So?

We are one week away from NAEP Day and the release of the 2024 NAEP Reading and Mathematics results! It’s a day portrayed as our Super Bowl, Christmas morning, and release of the Orange Crop report all rolled into one. So why, once again, am I not excited?
