
Significance.
Like so many of the key concepts and terms associated with large-scale testing (e.g., validity, reliability, comparability, fairness, standards, proficiency, etc.), significance is a common word, familiar to both technical and lay audiences. Often, however, that familiarity breeds contempt or at least confusion as a) there are key differences between the technical and lay definitions and interpretations of the term and/or b) the technical definition is just not as clear or useful as one might hope.
To a lay audience, significance implies that something is important and worthy of our attention.
To a technical audience, significance usually refers to statistical significance, indicating that a particular outcome is unlikely to have occurred by chance. With NAEP, and its use of the .05 level of significance, that significant outcome is a difference between two scores and it is likely that a difference of that size or greater would have occurred by chance less than 5 times out of 100.
Does statistical significance automatically imply that something is worthy of attention?
That has always been a tricky question for us to answer. Consequently, our initial reaction is to deflect. As trained statisticians, our fallback is to suggest differences that are not statistically significant are, for lack of a better term, not worthy of attention. And there must be a better term, for if you have invested significant time and resources into a particular intervention, policy, or reform effort, then obtaining a non-significant result is certainly going to be worthy of attention.
But what of those differences that are statistically significant? Are they significant?
In my early years in state testing, we attempted to answer that question by adopting the concept of practical significance; that is, the point at which the magnitude of the difference implied a real, noticeable, actionable difference in the level of knowledge and skills of the students, classes, schools, districts, or states being compared. Determining that level, of course, requires the ability to map scores to content-based descriptions of student performance so that professionals trained in content area instruction can make an informed judgment. Then we roll those judgments into a nice round number and state that, on average, a difference of 10, 25, or 50 points on the scale has practical significance.
And of course, we were silent on that statistical serpent slithering through our family of score reports – experiment-wise error. Of the more than 100 comparisons generated in a typical reporting of NAEP or state results, which five or more statistically significant differences we reported actually did occur by chance? Nobody knows.
Ah, what a tangled web is born, when we brainstorm to inform.
In short, I think that this definition from Merriam Webster best conveys our attempts to convey the meaning of significance of results of NAEP, or pretty much any large-scale state testing program, from a technical perspective:
SIGNIFICANCE implies a quality or character that should mark a thing as important but that is not self-evident and may or may not be recognized.
I was today years old when I read that definition and rarely has anything from a dictionary resonated so strongly with me.
All of which, in a roundabout way, leads me to the conclusion that the real value or importance of NAEP resides more in the lay definition of significance than the technical.
Significant NAEP Moments
The biennialish reporting of NAEP results falls somewhere between the highly anticipated fictional Frozen Concentrated Orange Juice (FCOJ) futures report at the center of the story in the movie Trading Places and the somewhat less fictional monthly jobs and inflation reports. And as I have argued throughout this series of posts, the NAEP scores themselves are not all that useful or easy to interpret.
Nevertheless, this simple congressionally-mandated monitoring tool has managed to have a significant impact on education policy and instruction in the United States, perhaps even a disproportionately significant impact since the pairing of state and NAEP test results under NCLB – arguably the most impactful pairing since H.B. Reese covered peanut butter in Hershey’s chocolate. The following is my list of the NAEP’s top five significant moments this century.
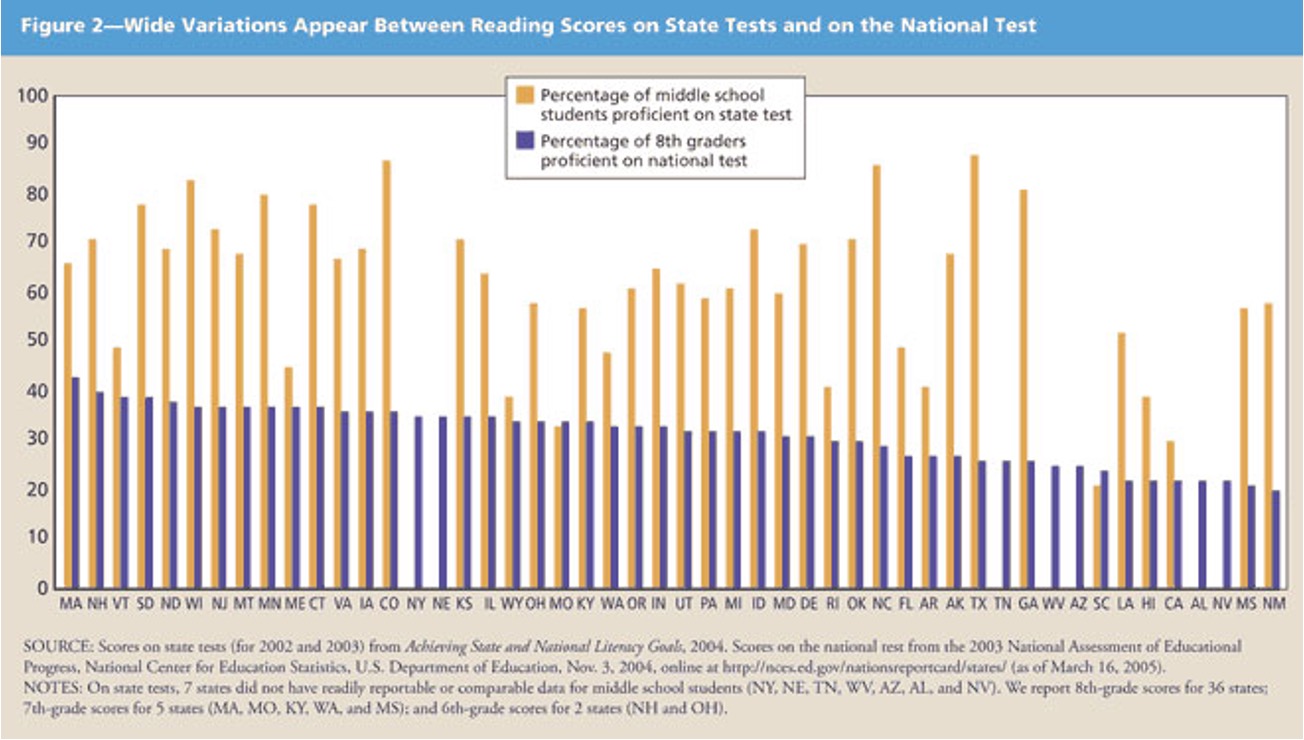
- State and NAEP percent proficient
At the top of the list has to be the graphic which I refer to as “the chart that changed American education.” In much the same was as Uncle Tom’s Cabin “started the Civil War” the simple chart showing the discrepancy between percent proficient on NAEP and state tests fostered a rallying cry that led directly to the creation of the Common Core State Standards. The havoc wrought by the introduction of those standards in 2010, the tests to measure them in 2015, and the manner in which they became a political landmine is unprecedented and still ongoing.
- Mapping Study
An offspring, perhaps, of that proficiency chart is the Mapping Study “placing” state achievement level thresholds on the NAEP scale. Woe to state officials that found themselves sitting alone on the bottom left side of that chart, their achievement standards significantly below NAEP and other states.
- The Mississippi “Not A” Miracle
Or perhaps the Mapping Study was the extra piece of ammunition state officials in Mississippi, Tennessee and other places needed to raise standards and jump start reform efforts in their state. Efforts that eventually showed them rising in ranking and performance on the NAEP scale. On the flip side, questions arise about states showing improvement on their state assessments, but not on NAEP.
- The Achievement Gaps
Next on my list of significant moments is the ability of NAEP to show persistent achievement gaps among key subgroups, and to relate those gaps in achievement to gaps in opportunity. This may be NAEP’s greatest impact, only falling to #4 on my list because we haven’t seemed to figure out what to do about those gaps.
As an aside, I know that there is a backlash against the deficit mindset associated with a focus on achievement gaps. Fair concern. Wrong solutions. For my money, few things have proven more pernicious than efforts to explain achievement gaps by conditioning on factors that caused them. Efforts that mask achievement gaps, such as presenting demographically-adjusted NAEP results, more often than not have the unintended consequence of minimizing the issue, leading to the perpetuation of the underlying problem – lack of educational opportunity.
- NAEP Stubbornness
Finally, in the fifth spot on my list is NAEP’s stubborn insistence on remaining just NAEP. To thine own self be true. Stay above the fray. With the passage of NCLB, there was pressure to make NAEP the national assessment tied directly to accountability. NAEP (i.e., NAGB) said no. Pressure to require alignment of state and NAEP achievement standards. NAEP said no. As states tests promised more and more, NAEP held firm. A few years later, pressure to align NAEP with the Common Core State Standards. NAEP said no. Pressure to break the trend line with the switch to computer-based testing. NAEP said no. I didn’t (and still don’t) agree with all of those decisions, but the wrong decision at any one of those pressure points and NAEP might have become just another test. A big part of what makes NAEP significant is its uniqueness.
NAEP – The Cheese Stands Alone
It has become so commonplace as to be trite to refer to NAEP as the “gold standard” but without really explain what that means. As I wrote in a 2019 post (one that over the years shockingly has become one of my top 3 viewed posts), NAEP is a damn fine test, nearly perfectly designed to do what it is intended to do. Form Follows Function. But it is one of a kind.
When held up against the (lowercase) standards that the field seems to hold so dear these days, how does NAEP fare?
NAEP
- is not transparent, not by a longshot
- is not aligned any particular set of standards
- is not personalized
- does not report student-level results
- does not provide “instructionally useful” or “actionable” information in the “accepted” sense of those terms
- takes 6 months or longer to report results
- has absolutely no relevance for students taking the test (or to the schools administering the test for that matter)
The list goes on and on.
And that’s OK. NAEP is NAEP.
There was a time in the 1980s when NAEP served as the model or “gold standard” and states based their state tests on the NAEP design, but that time has long since passed. State testing will continue to evolve into something more school-based and curriculum-embedded. NAEP cannot do that.
That’s OK. NAEP is NAEP.
NAEP has a Proficient bar that everyone (yes, everyone) agrees is too high and a Basic bar that’s too low, with a sweet spot in between that most states have determined is just right.
That’s OK. NAEP is NAEP.
NAEP has its trend lines. The trend line…No, sorry, I can’t. The trend lines, as is, are just embarrassing, but perhaps if they broke them from the scale and went on reporting them…
No, it’s fine. I’m fine. Everything’s fine. NAEP
NAEP has its trend lines.
That’s OK. NAEP is NAEP.
So, NAGB can continue to tweak NAEP here and there as they have done over the years, but here’s the bottom line NAEP.
Don’t go changing to try to please us. We want you just the way you are. Significant.
Header image by Colin Behrens from Pixabay

You must be logged in to post a comment.