
Little ditty about Jack and Diane
Two American kids growin’ up in the heartland
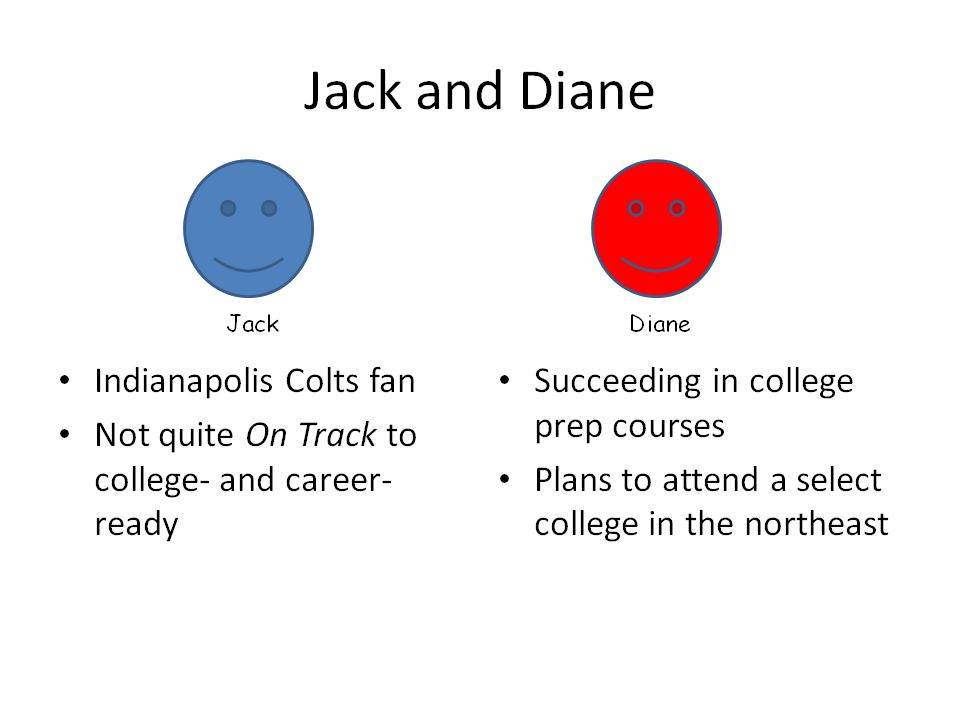
Diane’s college-ready, Jackie – not so sure
They took the new ISTEP, and got the same score
Charlie DePascale – This is the first in a series of three posts adapted from a workshop conducted at the 2015 annual conference at the New England Educational Research Organization (NEERO). Our topic today is standard error of measurement and the way that it is represented and explained on assessment reports for parents and guardians.
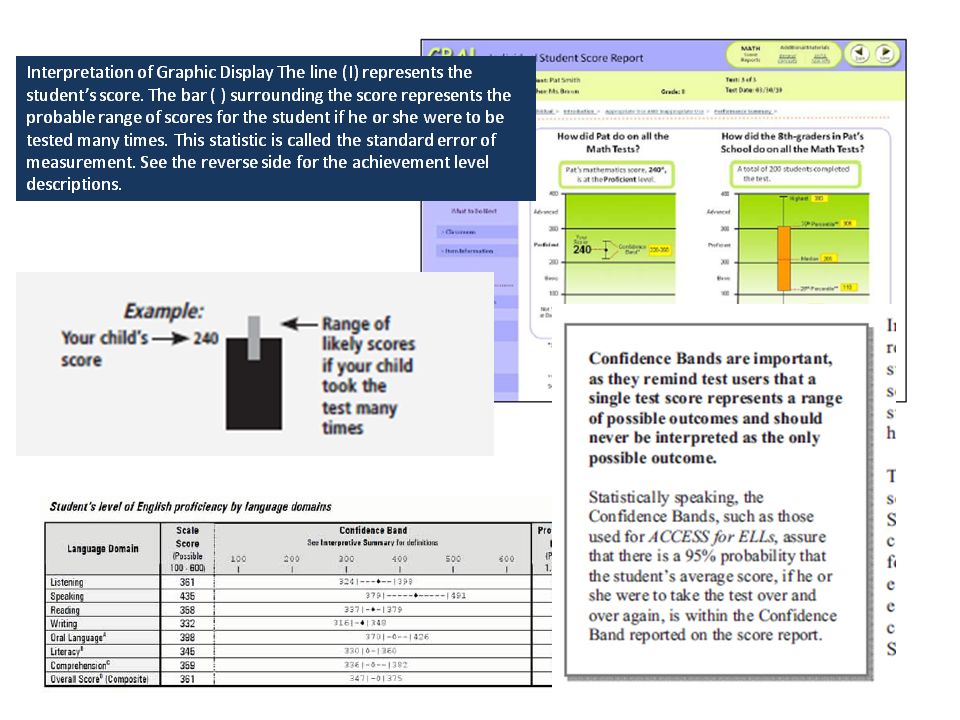
When student scores on state assessments and other standardized tests are reported to parents and guardians, it is common for the student’s score to be accompanied by an error band. Whether the reported score is a scaled score, a percentile, or even a raw score, some type of error band is provided to convey the imprecision in the single, observed score. This practice is certainly in keeping with the spirit and letter of the 2014 Joint Standards standard on Reporting and Interpretation.
The comments following the standard include as a specific example, “Score precision might be depicted by error bands or likely score ranges showing the standard error of measurement.” In an effort to provide interpretations appropriate to the audience, the reports usually describe in simple language that the error band represents the range of scores that the student is likely to receive if he or she took the test multiple times.
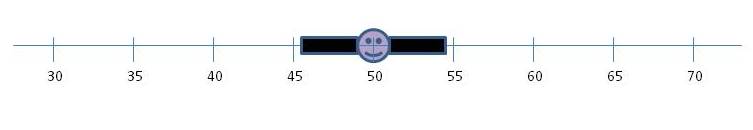
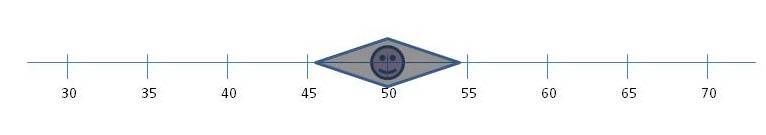
The problem is that in attempting to explain standard error of measurement in simple language, we distort the meaning of standard error of measurement and actually provide misleading and incorrect information to parents about their child’s performance. At the recent NEERO conference, during an invited panel discussion on how we can better communicate results of educational research to various audiences, Steve Sireci shared a quote from Albert Einstein Everything should be made as simple as possible, but not simpler Our problem is that in attempting to make the explanation of observed scores and standard error of measurement as simple as possible (and avoid the concept of true scores altogether) we went too far. As implied in the quote, going one step beyond as simple as possible leads to problems and unintended consequences. Let’s consider the case of our friends Jack and Diane from the beginning of the post. In addition to the fact that they received the same score on the Indiana state assessment, the ISTEP, what do we know about them? Based on what their teachers know about them, they may be surprised that Jack and Diane received the same score on the state assessment. But what do we tell their parents about their performance? Most likely, each of their parents will receive a report that looks something like this. That is, each of their parents will receive exactly the same information about their performance on the test. Each student received a score of 50 on this administration of the test, and if they took the test multiple times, their score is likely to fall within the band shown. In other words, in the eyes of the test there is no difference in the achievement of Jack and Diane. If the testing company or state is ambitious, they may even try to provide a little more information and report that if Jack and Diane took the test multiple times, their score would fall within the band two out of three times, or perhaps 68% of the time – if an obsessive psychometrician is involved. If the company is on the cutting edge of reporting the standard error of measurement, they may even attempt to taper the error bar to show that scores at the extremes are less likely to occur than scores near the middle of the band.
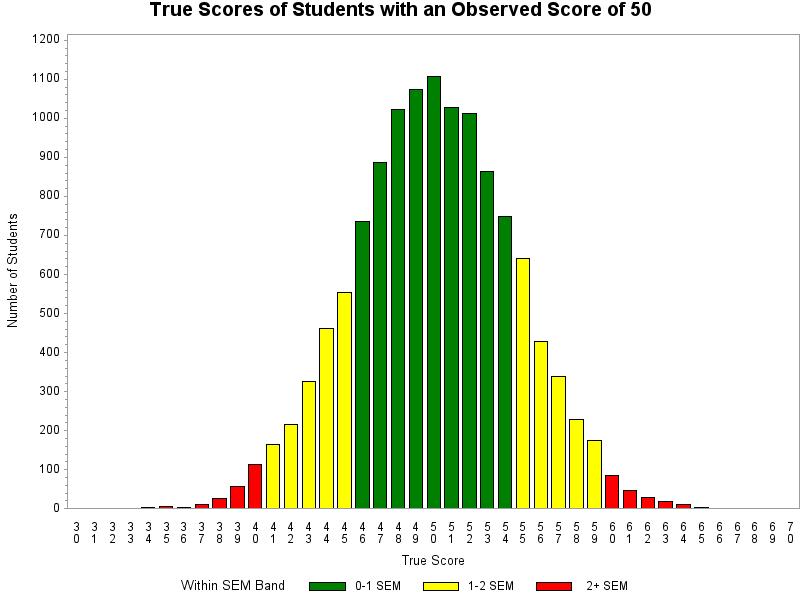
However, we all know that it’s more probable than not that interpretation is incorrect for Jack and incorrect for Diane. Really, we do know that. We know that if Diane took the test multiple times, her score is unlikely to fall within that error band 68% of the time. We know that if Jack took the test multiple times, his score is unlikely to fall within that error band 68% of the time. In fact, we know that we know nothing about what the distribution of the scores of two individual students such as Jack and Diane would look like if each of them took the test multiple times. If that is the case, what do we actually know about that score and error band – or at least what should we be willing to say with confidence? What can we say that is accurate?We know that 68% of the people who scored 50 on the test have a true score that falls within that 1 SEM band and that approximately 95% will have a true score that falls within a 2 SEM band. We also know that the likelihood of a student with a particular true score receiving a score of 50 on the test decreases the further that true score is from 50.
That information is useful and provides valuable information about the performance of students with an observed score of 50. It allows us to make statements such as:
Those two statements sound very similar to our descriptions of the error band discussed above. However, we don’t really want to mention the term true score in a report to parents. What is a simple way of describing a true score in language that everyone can understand – it is the average of the scores that a student will receive if he or she were to take the test many times (i.e., an infinite number of times). So, let’s try to introduce the idea of a student taking the test multiple times into our explanation of the error band for parents. And that’s where the problems start. We begin with two correct statements –
We then try to create a sick mashup of the concepts of SEM, observed score, and true score –
Then without changing any of the words, we try to make that statement a bit more user-friendly –
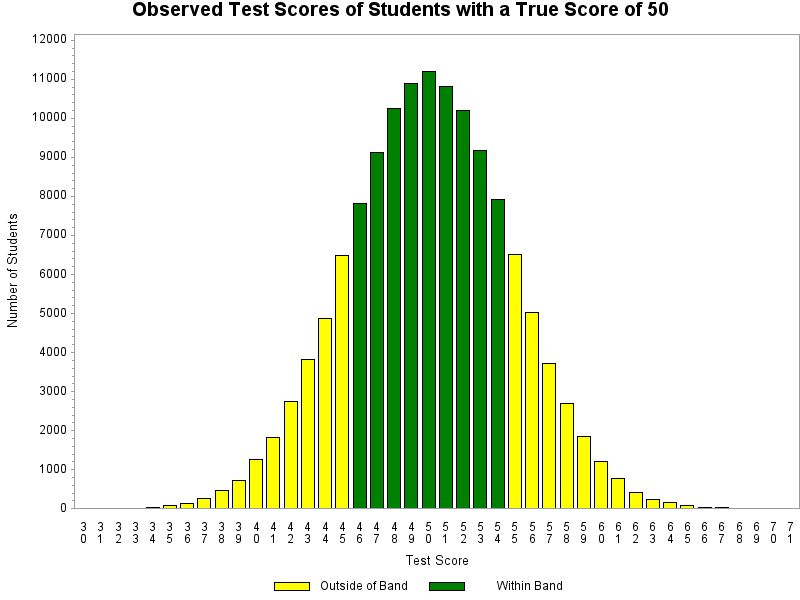
And just like that, we have moved from a description of an error band around an observed test score to a description of an error band around a true score. The problem is that unless the student’s true score is the same as the observed score, the statement is incorrect. When is our current interpretation correct?We know that students who have a true score of 50 will receive a score within that error band 68% of the time if they take the test multiple times. In other words, our common statement about the error band and the range of likely scores is accurate for students whose true score is the same as the observed score shown. The problem is that we do not know, and cannot know, which students have a true score of 50 based on the score on a single test.
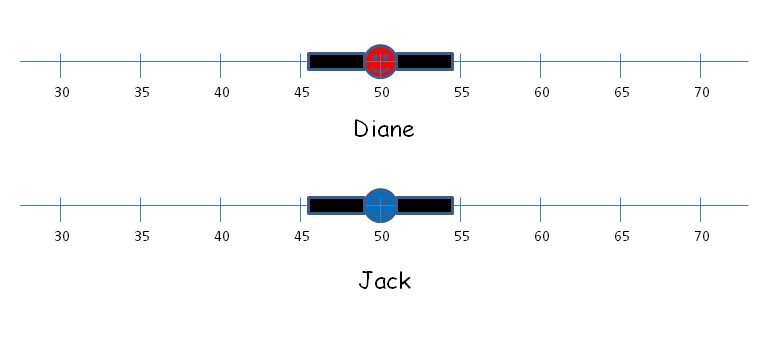
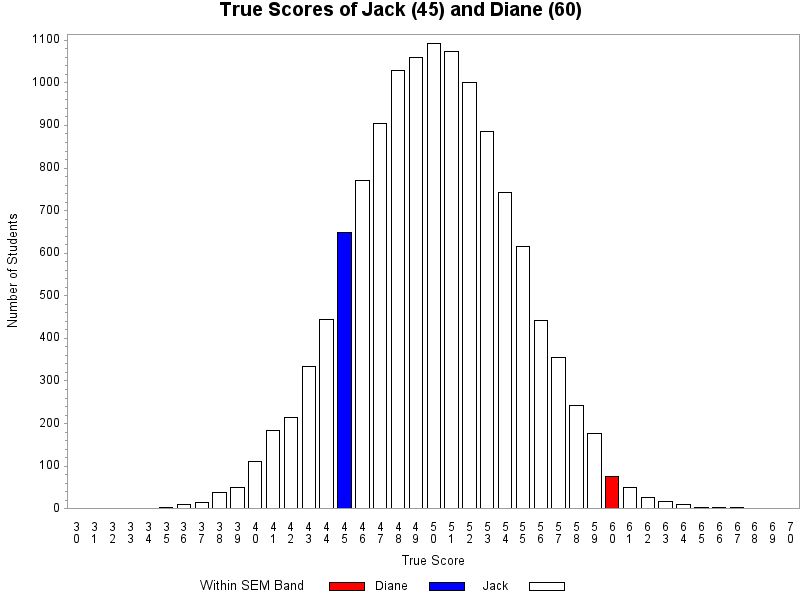
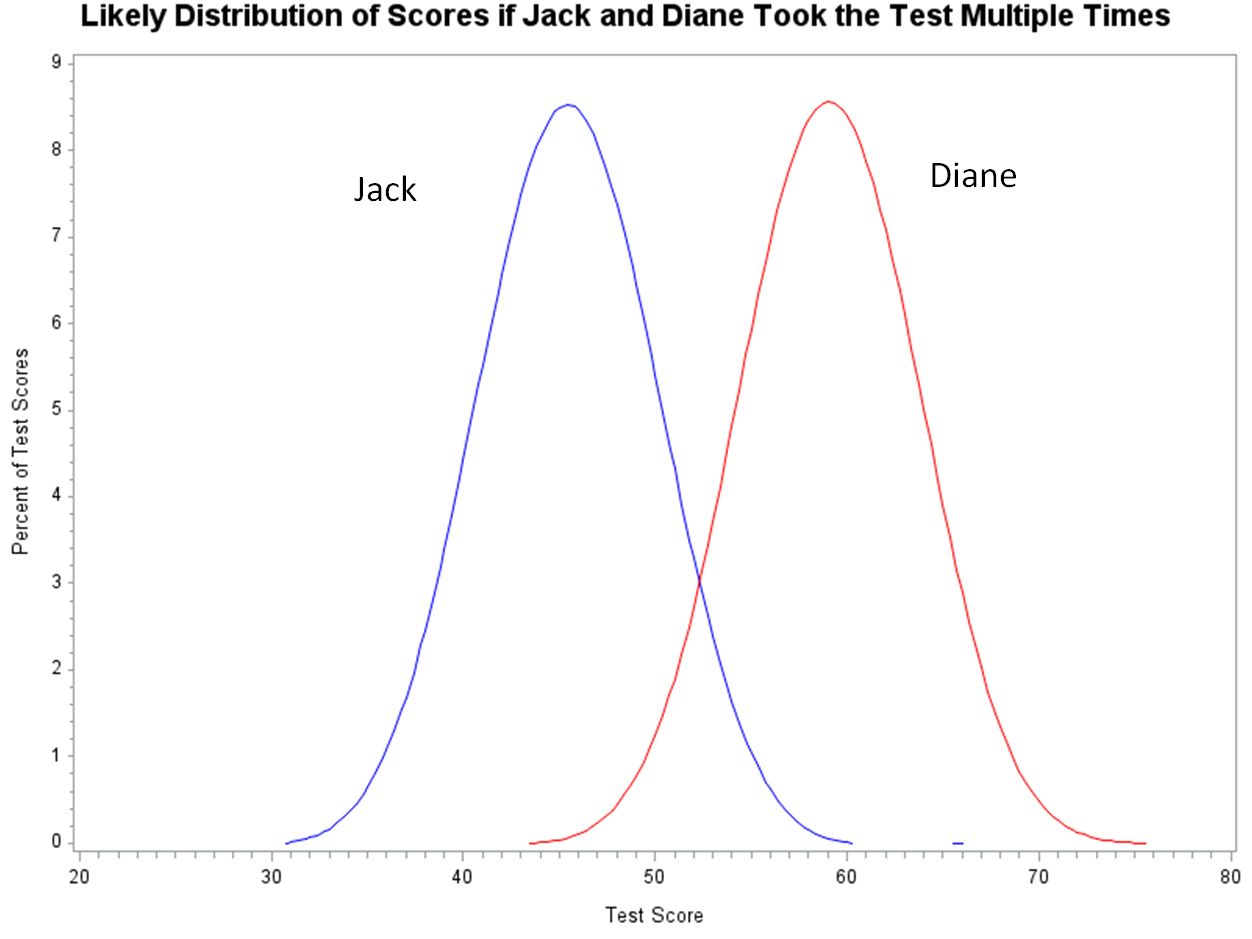
Key Difference Between the Common (Incorrect) Interpretation and a Correct InterpretationThe critical difference between our common interpretation of the error band and a correct interpretation is the shift in emphasis from the individual to the group. The correct interpretation actually focuses more on the imprecision of an individual student’s score on a single administration of a test. The correct interpretation makes it more clear that while we know a great deal about the group of students who received a score of 50 on the test, we know much less from this one score about an individual student. Conversely, the incorrect interpretation reflects a desire to focus the interpretation of the score on the individual; that is, to be able to say something fairly precise about the individual student’s score. This is consistent with the often stated goal that all assessments provide actionable information to inform instruction for individual students. What is the harm with the current interpretation?All of the descriptions of the error band offered above sound pretty similar. Does it really matter that the common descriptions are technically incorrect? In an era in which student scores on state assessments had limited use and the primary goal of the error band (and its description) was to convey some sense of the imprecision of single test score, the answer might be no, it does not really matter. However, in our current era of data-driven decision making and the emphasis on assessments providing actionable information to influence instructional choices, the correct interpretation of the error band is more important. As shown above, the current interpretation of the error band provides the same interpretation of achievement for every student who received an observed score of 50. In reality, students with a wide variety of achievement will earn the same observed score. Let’s return to Jack and Diane with their observed test score of 50. Consider the case where Jack’s true score is actually 45 and Diane’s true score is actually 60. In other words, Jack’s true score was just at the low end of the error band (he had a good day); and Diane’s true score is well above the error band (she had a bad day on test day).
If Jack and Diane were to take the test multiple times, we know that their likely range of scores will not be centered around their test score of 50; and their likely range of scores will not be the same. Jack’s scores across multiple test administrations will be centered around a score of 45, and Diane’s scores will be centered around a score of 60. As shown below, there would be relatively little overlap between their likely score distributions if Jack and Diane were to take the test multiple times. In all likelihood, teachers would follow very different instructional paths for Jack and for Diane.
Of course, we do not know Jack’s and Diane’s true score. We cannot actually produce the graph shown above based on the single test score that we have for Jack and Diane. In the long run, conveying a more accurate sense of uncertainty about an individual student’s score on a single test should be a good thing. It is important that we treat the single test score as just a single test score; and not attempt to extrapolate, generalize, or infer too much about a student’s overall achievement on the basis of that single test score. To a great extent, however, that type of generalization about student achievement rather than student performance on the test is exactly what the current description of the error band is promotes. By evoking the image of a student taking the test multiple times, we are deliberately suggesting that the single test score reflects typical achievement of the student. A more accurate explanation of the error band and the uncertainty surrounding an individual student’s score might lead to more emphasis on guidance to teachers on how to consider a student’s test score along with all of the other information that is available about that student’s achievement (e.g., course grades, performance on other assessments, performance on projects and performance-based tasks.) Ultimately, that type consideration of a test score in a larger context should be much more likely to result in improved instruction and improved student learning. Also, from an assessment perspective, being upfront about the level of uncertainty in an individual student’s score should lead to more sound assessment-based policies and make it less likely for teachers, parents, and policy makers to simply reject an assessment out of hand when they encounter discrepant or unexpected results for an individual student. Image by Albrecht Fietz from Pixabay |

One thought on “The Best That We Can Do – Communicating Assessment and Measurement Information”
Comments are closed.