
I wrap up my March series, NAEP by the Numbers, with the number .05 and a discussion of significance and differences. The significance of NAEP lies far beyond score differences within and across years that are statistically significant at the .05 level. Much of what makes NAEP significant is that it is different. Different from state tests. Different from tests administered by schools and districts. It serves a different purpose. A purpose for which it is well-designed. Simply put, NAEP is NAEP.
Monthly Archives: March 2026
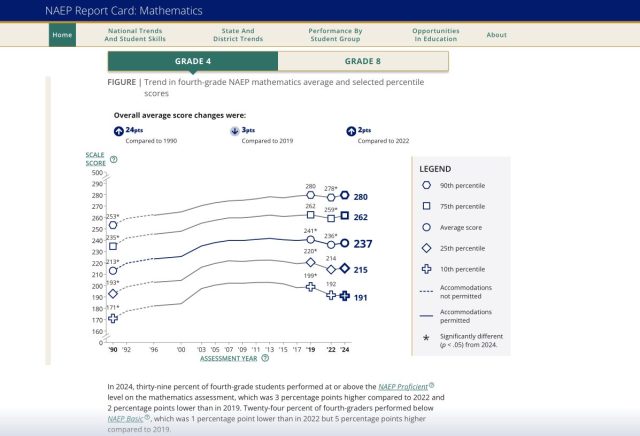
#NAEP250 – It’s Trending

“All good things must come to an end.” In the third post of my NAEP by the Numbers series, I ponder historically, philosophically, and a little bit technically, on whether that time has come for something that many believe are very good things – the NAEP trend lines.
Batting .500 with the NAEP Scale

In the second post of my NAEP by the Numbers series, I reflect on the NAEP 0-500 scales: both the Long Term Trend scale that stretches back to the 1970s and the new scale developed when NAEP began reporting state results some 35 years ago. At times, impressive. Other times frustrating. Love it or hate it, there’s nothing in our field quite like the NAEP scale.
20 at the 10th
For March, I’m planning a series of posts looking at NAEP by the numbers. The first two numbers are 20 and 10, as in the 20 students performing at the 10th percentile in reading and mathematics in a typical NAEP state sample. We’re all concerned that the bottom has been falling out of NAEP results, but my question is just how well we understand who those 10th percentile students are.
The 10th percentile sitting out there 1.28 sd from the mean is kind of an abstract concept, but a classroom-size sample of 20 kids is something we should be able to wrap our heads around.
