
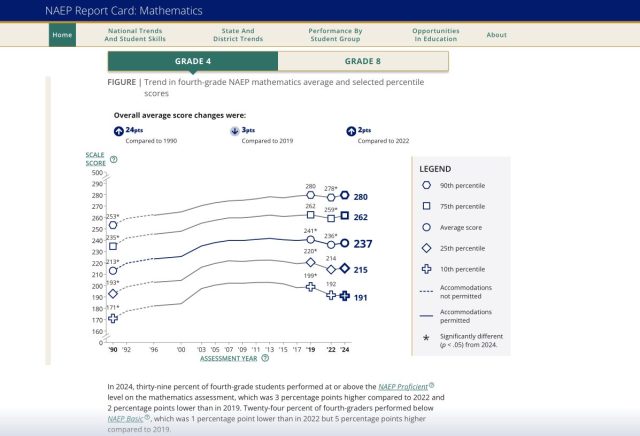
I wrap up my March series, NAEP by the Numbers, with the number .05 and a discussion of significance and differences. The significance of NAEP lies far beyond score differences within and across years that are statistically significant at the .05 level. Much of what makes NAEP significant is that it is different. Different from state tests. Different from tests administered by schools and districts. It serves a different purpose. A purpose for which it is well-designed. Simply put, NAEP is NAEP.
Author Archives: Charlie DePascale
#NAEP250 – It’s Trending

“All good things must come to an end.” In the third post of my NAEP by the Numbers series, I ponder historically, philosophically, and a little bit technically, on whether that time has come for something that many believe are very good things – the NAEP trend lines.
Batting .500 with the NAEP Scale

In the second post of my NAEP by the Numbers series, I reflect on the NAEP 0-500 scales: both the Long Term Trend scale that stretches back to the 1970s and the new scale developed when NAEP began reporting state results some 35 years ago. At times, impressive. Other times frustrating. Love it or hate it, there’s nothing in our field quite like the NAEP scale.
20 at the 10th
For March, I’m planning a series of posts looking at NAEP by the numbers. The first two numbers are 20 and 10, as in the 20 students performing at the 10th percentile in reading and mathematics in a typical NAEP state sample. We’re all concerned that the bottom has been falling out of NAEP results, but my question is just how well we understand who those 10th percentile students are.
The 10th percentile sitting out there 1.28 sd from the mean is kind of an abstract concept, but a classroom-size sample of 20 kids is something we should be able to wrap our heads around.
They Told Me There’d Be Consequences

The Olympics are over and it’s a blizzardy Monday morning. In other words, it’s a perfect time to peruse the preliminary program for the upcoming NCME annual meeting. Of course, every action has consequences. In this case, the consequence is a blog post about consequences. I’ll admit that I have no idea who John Ruskin is, but as I read through the program, I couldn’t help but think of these words of his, “What we think or what we know or what we believe is in the end of little consequence. The only thing of consequence is what we do.”
Frankenstein’s Graduate

In releasing the interim report outlining its new graduation Framework, Massachusetts boasts, “no other state will have implemented such a comprehensive approach to setting such high standards in education…”
My response, as the kids say, Sick brag, bro.
I’m not exactly sure where having “such high standards” compared to other states fits in the validity argument. I would be much more impressed by claims and evidence of having carefully identified the right graduation standards for the future and having a solid implementation plan for achieving those standards.
Regression To The Mean
Growth seemed to be a hot topic this month, so I set out to write a blog post about student growth and how it should be (and shouldn’t be) used in school accountability systems. Then I read the Senate HELP committee’s RFI. When my blood pressure returned close to normal, my topic had changed. I had expected and can even accept the “school choice” vibes that ran through the RFI. What I cannot stomach, however, is the return to misplaced blame and outright meanness that helped derail the last 25 years of Education Reform.
What Might Have Been

We are now a quarter of the way through the 21st century and about the same length of time into the current era of test-based school accountability. Like most Education Reform initiatives, with NCLB we jumped right in with testing and accountability – proudly flying the plane while we were building it. Except that we never actually get around to rebuilding it. Sure, we update the snacks, swap out seats, and add wi-fi, but the basic public education plane remains the same. What if we tried a different approach. What might have been?
Book ‘Em, Danno!

One way I that check the “pulse of the nation” on education is though the topics that family members raise with me around the table at holiday gatherings. Last year it was Massachusetts ending the MCAS graduation requirement, before MCAS it was chronic absenteeism and NAEP scores, and before that colleges dropping the SAT and ACT. This year, the topic was books and kids not reading very many of them. So, let’s turn the page on the 2026 blog year by considering books.
Embracing Absurdity In 2025

Thanks to all who joined me in embracing the absurdity of 2025 through my blog, Embrace The Absurd. In this final post of 2025, I recap the most popular posts and issues we discussed in 2025 and offer some words of wisdom (not mine) to guide us into the new year ahead.
Wishing you and yours happiness, health, proficiency, competency, relevance, validity, reliability, fairness, engagement, and purpose in 2026.
